


Small Caps Live Weekly Summary
Seasonal Effects SHOE XPP GAW DFS KINO MPAC PMP CRL CARD MMX SIM


As promised, here is the first part of the recorded audio of our live 2021 review and 2022 preview. Part Two next week, and if investors like this format we may do some more of these going forward.
Leo also attempted to “Sell It To The City” this week with a stock pitch as part of the new PI World feature:
After a quiet couple of weeks for news, we are well into trading & results season and the small cap news flow has been brisk, with 11 companies summarised today I hope readers will forgive the late email release!
WayneJ also returns this week after a well-earned break with a Large Caps Live looking at, amongst others, the topic of seasonal effects.
Large Caps Live
During the holidays I got a copy of the 2022 Stock Trader’s Almanac. For anyone that does not know about this publication, it provides an analysis of trading patterns based on historical precedents for the US markets. Obviously, the key question is whether there will be (1) a recovery in the Republican party (2) where and what will Trump’s influence be? And all the above questions are really dependent on Covid and when / if normalisation occurs. Anyway – looking at the January page for the Almanac I notice:
S&P 500 UP / Down – 43/ 29 – average 1.1%
Nasdaq Up / Down – 34 / 17 – average 2.8%
Russell 1000 Up / Down – 26/ 17 – average 1.1%
The way to read that is that in the last x years the S&P was up 43 times and down 29 times in January. And the AVERAGE of ALL the Januarys was up 1.1%.
The following however is where the book pays for itself:
(1) In a midterm election year S&P averages -0.7% and NASDAQ 0.01%, Russell 1000 – 0.6% for January.
(2) Also interesting is the first 5 days effect. Apparently, the last 46 years up First Five days of January have been followed by full-year gains 38 times ie a hit ratio of 82.6% and a 13.7% average gain. The 25 down First Five days were followed by 14 up years and 11 down years with an average gain of 1.0%. ie The FIRST FIVE DAYS OF JANUARY have a circa 83% hit rate of reflecting the direction of the rest of the year
(3) January Barometer - developed by Yale Hirsch who I believe is the father of the current author – reflects that the direction of January reflects the direction of the whole year with an accuracy of 84.5%. ie The direction of the whole month of January reflects the rest of the year with a circa 84.5% accuracy
(4) Bear correction: What really struck me this morning was the following sentence:
every down January since 1940 was followed by a new or continuing bear market, a 10% correction, or a flat year. Down Januarys were followed by substantial declines average minus 13.0%.
In the US mutual funds sell winners and losers (to offset the tax) by the end of Nov (end of most mutual fund tax years). They are then not allowed to buy them back again for 60 days (I had thought it was 30 days but recently read 60 days). So 'dogs' get sold in Oct / Nov and bought back from late Dec into Jan.
So where does that leave us?
1. Obviously, the markets have been weak for the first few days of this year.
2. The historical analysis by Hirsch suggests that portends for a weak 2022 (at least for the US).
3. The fact this is a mid-term election year also suggest weak US performance this year.
4. In the years that the above discussed, models have not worked well there have often been wars etc. The world seems right now to be in an interesting situation with Ukraine.
5. One might also argue that Covid is one of the unprecedented events similar to war that could knock historical precedent.
6. The Fed minutes and the expectation that the Fed is moving from ‘ultra-accommodative’ to ‘neutral’ has shaken the markets (particularly ‘spec-tech’ as the FT puts it.
The above paints a fairly bleak view of the US. So if I was just to look at the above list, and what has happened in markets so far I would be wondering are we having / about to have a 10% 'correction' or a 20% 'crash'? Arguably a lot of big-cap names are already off more than 20% from the peak. My problem with the above list is that I am not sure how statistically robust any of the analysis is.
On the positive side what strikes me is that:
1. Surely ‘normalisation’ reflects that we are getting to the end of the Covid issues
2. Labour market shortages (US unemployment of 3.9%) strike me as an economy doing well despite Covid – so what happens when we ‘normalise’?
Actually, on that latter point, I think that what is being missed is that unemployment is down because labour force participation is down - I think this is understandable with Covid that many people have withdrawn from the labour market - though the trend had started over a decade before. So I am thinking if we start normalising from March into the summer (and remember the comment re mid-terms) could labour force participation increase leading to some easing of pressure in the labour market ---- thus perhaps slowing down the 'tightening' (=normalisation) by the Fed?
However, hidden amongst the broad strength in the NASDAQ is a lot of stocks that have sold off:

So perhaps 2022 is finally the year we see Value start to outperform again:

Small Caps
Shoezone (SHOE.L) - Final Results
Results this week read very well and show a big turnaround from their H1 performance which was, of course, heavily impacted by lockdowns.

The big driver has been store revenue of £65.8m for H2 vs just £22.8m for H1. Digital revenue was down in H2 to £12.9m vs £17.6m in H1 but this is to be expected with the world opening up again. Shoes tend to be the sort of thing you really want to try on and although they offer free returns to their stores, postal returns are £2.50 which is enough to make cheap shoes not a great thing to buy online when there are physical options. So Shoezone remains very much a play on the high street.
When Mark looked at them before they were flagging that they would be unlikely to pay a dividend until 2025. This made them uninvestable for him and he even thought that they should have raised money when their share price bounced significantly while trading was still in the doldrums. The management appear to have been correct to muddle through, however, since their financial position has markedly improved with a net cash balance of £14.6m at period end. This means they now say:
Post Period end, as at 10 January 2022:
· £4.4m outstanding CLBILS loan now fully paid off
· Company is debt free
· Eligible to reinstate modest dividend payments, with an intention to return to the dividend list during the current period
The rapid turnaround is a testament to their strategy of running very short leases. Which, in a declining high street, is clearly the way to go:
· Net closure of 50 unprofitable locations
· 10 existing store conversions
· Annualised lease renewal savings of £1.8m, an average reduction of 53%
· Average lease length of 1.9 years (2020: 2 years)
So they have cut out over 10% of their estate when the stores proved unprofitable. This may well be the time to go for longer leases to try to lock in attractive pricing. But it does depend on how much their fit-out costs are. They say:
Property supply continues to outstrip demand and we therefore expect to take advantage of this environment and significantly improve our property portfolio over the medium term.
They have a lot of opportunities to tweak their estate but we can't see them bucking the trend to drive significant store growth on the high street. Not that this necessarily matters - if a company is sufficiently profitable, they can make decent returns from a fairly static market via growing margins or cutting costs. Their strategy has been to move more to “Big Box” stores which allow them to sell more higher-margin branded items:
Big Box stores offer 650 styles per season (350 branded), Hybrid stores offer 475 styles per season (175 branded), and Original stores offer 300 core styles per season. As we refit existing stores to our new formats, the branded mix will continue to form a higher proportion of our overall sales.
However, the absolute numbers of big box stores are static and they are growing these as a proportion of stores via the closure of unprofitable original store types, not via absolute growth in numbers. (Although perhaps the pandemic has delayed this somewhat.)
· 410 stores at Period end comprising:
o 343 Original (2020: 403)
o 51 Big Box (2020: 51)
o 16 Hybrid (2020: 6)
These results with 14p EPS look to be a beat on Zeus's adjusted EPS forecast of 13.5p for the year to 2nd October. Although we see some issues valuing the company purely on this basis:
The first is how sustainable this level of EPS is going forward. They don't say how much government support they received in the year which obviously won't continue. Zeus consider this year’s performance to be a one-off, with 10.6p for FY 2022 before growth resumes to 11.1p in FY 2023. Although they do say:
The Group trades c.38% below pre-pandemic levels, despite what we see as a much improved and more balanced store and digital retail model, creating scope for significant market share gains.
The second is that part of this beat is due to factors they mentioned in their last trading statement:
…alongside the ongoing year-end review process, the Company has concluded that it will not be required to recognise approximately £1.5m of one off additional pension contributions within its income statement (a non-trading entry). This adjustment has led to an increase in expected profit before tax for the full year. The Company has also benefitted from favourable foreign exchange rates, particularly versus the dollar, which adds a further revaluation benefit of approximately £0.4m from the previous forecast.
This £1.5m pension contribution didn't go away, of course. Based on accounting rules, it went through the cash flow statement, not the income statement. It was still real cash that left the business, however.
Adjusting for pension contributions gives 11.8p underlying EPS. Net cash adjusting for provisions & FX is £10.6m or 21p per share. In summary, the current historical P/E of c.10, rising to about 12 going forward looks about right for a business that is well-run but never going to grow particularly quickly.
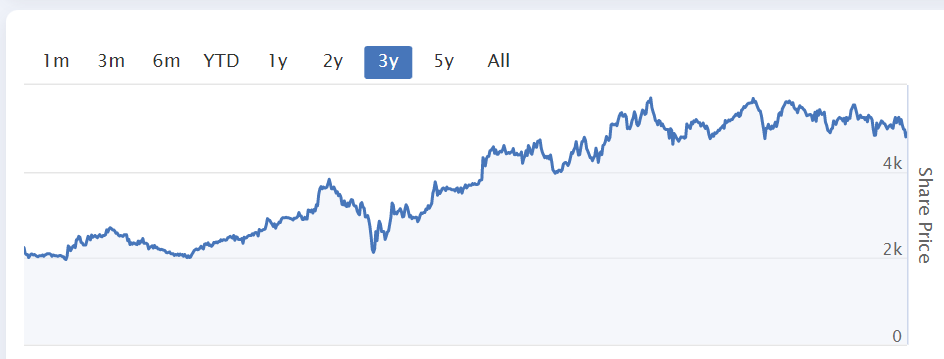
XP Power (XPP.L) - Trading Update
This is an interesting stock - Leo held these at one point in the past, but hadn’t looked at them in a while. As you can see they peaked in February last year after a very strong run into, and recovery from, covid:
So here's the trading update:
The strong order intake momentum seen throughout 2021 continued through Q4, with orders up 65% at constant currency and 58% as reported to £88.6 million with a book to bill of 1.51x.
They compare Book to Bill to Q4 2020, which might not have been a fair comparison, but FWIW in Q4 2019, it was similar at 0.92x.
All sectors saw robust order intake growth, with orders well above both 2020 and 2019 levels, and above our expectations.
Nice to see a 2019 comparison here at least.
Full year order intake was up 43% at constant currency and the Group enters 2022 with a record order book.
Frankly, Leo is a little surprised. Healthcare is a major seller and in the UK we have seen investment collapse outside of covid-specific areas as other treatments have been halted.
Revenue in Q4 was £58.8 million, up 4% year-on-year (down 1% as reported), slightly down on the Board's expectations as the previously announced supply chain constraints, specifically the availability of key components and freight capacity impacted customer deliveries towards the end of the year.
As any reasonable person would expect.
As a result, 2021 adjusted operating profit is anticipated to be modestly below the lower end of current market expectations.
So this is a near-term profits warning.
For the 2021 financial year as a whole, revenue has grown 10% on a constant currency basis (3% as reported) to £240.2 million against what was a tough prior year comparator which benefitted from £15-20 million of healthcare equipment related sales directly linked to COVID-19.
So they must have had one-off orders for power supplies for ventilators or something similar. Despite the near-term profits warning, the following explains why the share price reaction has been positive to this update:
Net debt at 31 December 2021 was £24.7 million, compared with £17.9 million at 31 December 2020, reflecting higher working capital to support the record order book and future revenue growth.
High order book plus higher working capital is a sure sign of imminent higher revenue (for a properly run company). With inventory, it is always worth looking at finished goods versus raw materials. However, this is usually only broken down in the annual report.

Obviously, this is a full year out of date but shows you what to look for when the Annual Report comes out.
The recommended dividend for the fourth quarter of 2021 will be announced with the 2021 Final Results on 1 March 2022 but is not expected to be less than 36 pence per share, representing a minimum total dividend of 94 pence per share for the year.
That's a 2% yield, not bad for a growth company. Here's the all-important outlook:
The Group starts the new financial year with a record order book, which provides excellent visibility through 2022. While we remain mindful of the ongoing uncertainties in respect of component supply and freight capacity and costs and are continuing to monitor the situation carefully, we are optimistic on the Group's prospects for the year ahead and plan to invest in new manufacturing capacity in 2022 to support the future growth of the Group.
So, they are about to or have already reached manufacturing capacity. It is important to look at how previous investments in increased capacity have gone in the past, and whether they can make scalable stepwise increases or need to e.g. buy/lease new buildings.
Longer term, the Board believes XP Power to be very well positioned to grow ahead of its end markets, supported by its strong cash generation and a robust balance sheet.
Clearly, this is just their "best guess" and should be taken with a grain of salt.
Edison's response to this update is to downgrade FY 2021 normalised diluted EPS by 3% to 184.4p and leave FY 2022 static at 203.7p. So that's a forward PE of 24.6x. But, based on this update, Leo thinks revenue is due to grow more than the 7% currently forecast. So, subject to costs, EPS could be beaten significantly. Edison comment only that:
We ... note that stronger than expected order intake increases confidence in our unchanged FY22 forecasts.
In summary, if somebody is wanting to pay 25x earnings for a company, they could do a lot worse than XP Power.
Games Workshop (GAW.L) - Trading Statement
The phrase "try our best" appears 3 times in this week’s statement. This is not an expression Leo has used personally since childhood, but when he did, it was when he'd done some task and wasn't happy with the result. On the off chance it wasn't immediately obvious that he'd made a mess of it, and to avoid having to do it again properly, he’d announce that he’d "tried my best". Perhaps, if Leo had been paid the £667k pa that Kevin Rountree earns to make toys, he’d have been more motivated to keep practising.
The outlook statement itself isn't of much use:
I'm mindful of the uncertainty caused by COVID-19 and the expectation of more growth given our recent performance. To help inform shareholders and followers of Games Workshop as best we can, we will continue to provide regular updates to the market. We are pleased to confirm that we continue to trade in line with expectations and look forward to providing a further update to the market in due course.
So he did his best, but the figures tell the true story:

Basically, underlying profit has fallen heavily, and the only reason that isn't visible at the headline level is because of one-off royalty income.
Royalties receivable in the period increased by £11.4 million to £20.1 million. This includes £13.7 million (2020: £2.3 million) of guaranteed royalty income which is recognised on the signing of new licence contracts, while additional royalty income earned was equal to the prior period at £6.4 million. As always, this income continues to be uncertain and, as we recognise guaranteed royalty income in full on signing the contract, it is even harder to predict when further income will be recognised.
So most of it was one-off, and the rest was somewhat recurring, but almost entirely outside of their control.
We have again found great successes in licensing Warhammer into computer games with some world class partners. A number of major video games are due to be launched in 2022 including Total War: Warhammer 3, Warhammer 40,000: Darktide and Lost Crusade.
Sounds like an over-reach to Leo, but they have no capital at risk here. With the guaranteed level of royalties already accounted for, there can be no guarantee of any further payments. This is good news, however:
Deals have been announced to launch a major online game set in the Age of Sigmar universe as well as Space Marine 2. We continue to search for the right long term partners to exploit other IP opportunities: we have some further exciting plans in development.
There are some reasons to be optimistic here, however. Falling core profits do not seem to be due to a lack of demand, but due to limits in supply and higher costs.
To be honest, I'm a little disappointed that we have not delivered to our full potential: e.g. having to delay some of our new products due to shipping issues. I hope we get the opportunity in the second half….
the ongoing COVID-19 restrictions there have kept our stores closed [in Australia]…
Various delays have resulted in a decision to move our new release schedule by c. 10 weeks to allow us to catch up [in Asia]
Also, shipping costs may stop rising or even fall. So lots of tailwinds for H2. Leo is less optimistic that staff costs will abate, however. The start of H2 will have been affected by high (presumably paid) staff absences, and the labour market seems to be tight across the world right now.
DFS (DFS.L) - Trading Statement
As Leo has been reporting, the post-Christmas promotional period has been stronger than he expected for ScS, and this is reflected in the DFS statement. DFS are a bit slower with their reporting than ScS, one of many ways they seem to be operationally inferior, although they are a better company in many ways - twice the market share, higher brand value, arguably superior market positioning.
…trading update for the twenty-six week financial reporting period to 26 December 2021
Strong order intake performance across the first half as a whole, with the important post-Christmas trading period starting well
Based upon reasonable delivery assumptions in H2, our scenarios for the full year Profit before Tax and Amortisation remain unchanged
It is worth digging into deliveries a bit more since this is key for whether ScS have to report a revenue miss, one of the few remaining risks (and even then short term) of holding the share:
Gross sales (excluding discontinued Sofa Workshop operations) increased by 10% against the 26 week FY19 pre-pandemic comparable period*, but were 2% lower than the 26 week period ended 27 December 2020**.
Leo’s data on ScS shows higher deliveries than pre-pandemic until mid-October, then lower deliveries. The data isn't accurate enough to say whether it is ahead or behind in aggregate. There are also differences between ScS and DFS's supply chain, with DFS partially vertically integrated. In-house manufacturing should improve margins but could either improve or worsen supply at times of stress, so the read-across between ScS and DFS here is limited.
Covid-related absences, supplier manufacturing capacity and logistics performance, have affected both the furniture and wider retail industry, particularly in the first quarter. We have however seen a strong increase in deliveries across our second quarter, with overall gross sales in Q2 23% higher than in Q1.
Although Leo’s figures show deliveries starting well for ScS, in what corresponds to DFS's Q2, this was not sustained.
Looking forward, as a result of the significant recent operational investment in The Sofa Delivery Company, combined with the additional production capacity from new manufacturing partners, we have confidence that delivery levels will continue to grow across H2 FY22.
This could cause a competitive problem for ScS - if DFS can deliver in 10 weeks but ScS can't then they will lose customers.
Notwithstanding the risk to delivery performance that the ongoing pandemic represents, our resilient and sizeable order bank means that any disruption experienced typically does not have a material impact on long-term profitability. This would instead cause profits to shift into a future reporting period.
Again, this "shift" only applies where the competition also had extended lead times. Very much unlike ScS, DFS has quite a lot of debt:
We expect to report a closing interim net bank debt position at half year (excluding capitalised leases) in the region of £65-70m. This increase relative to the £19m of net bank debt reported at the end of the prior financial period reflects some normalisation of our working capital position and c. £28m of cash utilised for dividend payments and employee scheme related share repurchases.
This should be very concerning for DFS shareholders. Any potential investor should look very carefully at how much they owe their customers and their lease liabilities as well as how much they owe banks. Although, we believe what killed ScS in a previous debt-laden incarnation was credit insurers withdrawing coverage for their suppliers, which would be somewhat less of a problem for DFS who have vertically integrated.
It is clear that we currently have significant capital available to deploy, and we will share our future investment and special capital return plans, together with our decision-making parameters, at our upcoming investor event on 15 March 2022.
OK, this is really interesting. If indebted DFS are formulating "special capital return plans", then surely ScS, who are swimming in cash, can afford to do so too? And given the much greater agility of ScS, maybe they will announce something at the start of February. Although based on indications from the cautious management, we don't expect it to be very large.
Kinovo (KINO.L) - Disposal of Construction Division
Kinovo is really a story of transformation from a debt-ridden middling margin, jobbing gas and building services company (under the name "Bilby") to a highly cash-generative, high-margin business with long-term recurring revenue contracts in what they call "Regulation, Regeneration and Renewables".
In their 2015 Admissions Statement they said:
Bilby Plc (the Company) has been established as a holding company to provide a platform for strategic acquisitions in the gas heating and general building services industries. Bilby acquired the shares of P&R Installation Company Limited (P&R) on 2 March 2015 through a share for share exchange and P&R is now a wholly owned operating subsidiary of Bilby
In 2016 they announced:
Bilby, the holding company for gas heating, electrical and building services companies, is pleased to announce the acquisition of DCB (Kent) Limited for a maximum consideration of £4.0 million. DCB provides high quality building, refurbishment and maintenance services to housing associations and local authorities throughout Kent, Sussex, Essex and London. DCB also provides disabled adaptations to occupied homes and public buildings through a specialist division, Living Solutions, which was founded in 2001.
Rollups sometimes work, and sometimes they don't, and this one didn't. In the H1 results on 7th December they said:
Discontinued operations - advanced discussions to sell non-core construction business, DCB (Kent) Ltd
And this week they announced:
Kinovo Plc (AIM: KINO), the specialist property services Group that delivers compliance and sustainability solutions, announces that it has entered into an agreement to sell the Company's non-core construction division, DCB (Kent) Limited ("DCB"), for a total deferred consideration of up to £5.0 million.
We'd like to say this marks the end of their transformation, but there are quite a few loose ends:
The construction division has been acquired by MCG Global Limited on the following terms, consisting of four constituent elements:
· firstly, up to £1.9 million will be payable on the successful completion of current projects, most of which are due in the calendar year 2022;
· secondly, up to £2.1 million will be payable on trade settlements relating to these current contracts; and
· the third and fourth elements, upon which £0.5 million will be payable for each element, relate to the achievement of a £3.0 million profit before tax target, for each of the years ending March 2023 and March 2024 respectively.
So basically this is 100% deferred consideration. They are effectively giving this away for nothing…all the payments are linked to the successful completion of existing ongoing projects. This would be understandable if it was heavily loss-making but it seems to be profitable. Here's the 5 year PBT record of DCB (Kent):
March 2017: 590k, 2018: 801k, 2019: 372k 2020: 17k, 2021: 241k
It is like they just couldn’t be bothered with DCB (Kent) anymore and gave it away, or there are a lot of nasties in there and they don’t want any group guarantees or the reputational risk to be in place going forward.
There is a lot to like about Kinovo, particularly if it can successfully complete its transformation to higher-margin work. However, those bidding up the price of Kinovo this week on this announcement presumably didn’t understand it, since this is a net negative for Kinovo. Either they have just given away a profitable (although non-core) business where the buyer is paying any consideration from the proceeds of contracts already won by the subsidiary, or there are massive hidden liabilities in DCB (Kent) that are being disposed of. Which, of course, doesn’t look great for how the rest of Kinovo is being run.
Mpac (MPAC.L) - Full Year Trading Update
The business has been trading well and this morning they provided another update.
The Board is pleased to announce that the Group has had a strong FY21 and expects to report revenue, underlying profit before tax, and closing cash in line with market expectations.
So, prima facie, an inline trading statement.
Order intake, revenue and underlying profit before tax have all increased over the period, underpinned by the continued progress of delivering the 'One Mpac' business model. This is despite the operational challenges experienced during the year caused by the global supply chain crisis and the impact on labour availability due to Covid-19 resurgence.
So revenue and PBT rose in line with expectations despite challenges. But we are not sure there were any expectations for order intake. And alerts should be going off over that "underlying" qualifier.
The strong H1 2021 order intake continued through H2, delivering full year growth from the resilient end markets which Mpac serves including essential healthcare, and food and beverage. The Group ended 2021 with a closing order book of circa £77.0m (December 2020: £55.5m), providing good coverage of 2022 forecast revenue. This, along with a healthy prospect pipeline, means the Group has an encouraging outlook for FY22.
This seems like a good time to look at 2022 forecasts. FY 2022 revenue is forecast to be £105m. This year is now forecast to be £97.5m but was forecast to be £95m this time last year. So order book coverage is 73% compared to 58% last year. To some extent, this will reflect greater certainty than last year when we were in full lockdown. So for a fairer comparison, pre covid, January 2020 forecasts for FY 2020 were for £95m on an order book of "close to £50m". Therefore this appears to be an unprecedented level of order book coverage.
Following the announcement of the contract win with FREYR Battery in July 2021, the Group has made good progress in the development and build of the clean energy casting and unit cell assembly line. The project remains on track to be completed in Q3 2022.
On track is good. Completed is not so good. Investors are, of course, hoping for an extension.
So, what do the brokers say?
FY 2021 £97.5m revenue, £8.2m adjusted PBT and 32.2p adjusted EPS. For FY 2022 they are forecasting £105m revenue. Interestingly, pre-covid they (Shore) had £95m for FY 2020 and £105m for FY 2021. This suggests that covid has not set them a year behind and that the order book coverage indicates a material upgrade is on its way.
Leo thinks an upgrade is pretty much a dead cert. And we even have the date.
Our full year results, for the year ended 31 December 2021, are scheduled to be announced in the week commencing 14 March 2022.
However, as Mark frequently points out, these "underlying EPS" figures are nonsense. Firstly, one of the things they adjust out is the pension running costs. Secondly, large pension recovery payments don't go through the P&L. H1 results have the hard figures:
Profit before tax includes charges in respect of the defined benefit pension schemes' administration costs of £0.6m (2020: £0.5m) and a net financing income on pension scheme balances of £0.1m (2020: £0.2m). Payments to the Group's UK defined benefit pension scheme in the period included £1.0m (2020: £1.0m) in respect of the agreed deficit recovery plan and £0.3m in respect of the profit-sharing arrangement. Payments to the US defined benefit pension plan were £0.3m (2020: £0.1m).
OK, so that appears straightforward: just add that up and work it out per share. You probably want to ignore the financing income since the pension surplus is a mirage, as previously covered. The total is £2.2m for H1, or 10.8p a share, bringing adjusted EPS down from 18.5p to 7p.
So of course, after calculating this, the next thing you want to know is the full-year effect. For this, you need to know the details of the "profit-sharing agreement". Fortunately no need to go back to the Annual Report for this.
…if underlying operating profit (operating profit before non-underlying items) in any year is in excess of £5.5m, the Company will pay to the Fund an amount of 33% of the difference between the annual underlying operating profit and £5.5m, subject to a cap on underlying operating profit of £10.0m for the purpose of calculating this payment; this part of the agreement will fall away in 2021 if the funding deficit is below certain levels; and
OK so H1 underlying operating profit was £4.8m. An excess of 2.1m over the halved annual allowance of £5.5m. And 33% of that is £0.7m. But I've only counted £0.3m! And that goes back to the fact that pension deficit payments do not go through the P&L, only the cash flow statement. So what you see is the profit share from 20H2, paid this time. What you really want to know is how much profit share has been accrued, and that's £0.7m. When you plug that in, you get an H1 EPS of just 5.8p!!!
But what about the US plan? That seems quite volatile - up to £0.3m from £0.1m last year. There's no further detail in the 2020 annual report, so it looks like £0.3m every 6m is the new normal there.
So how does this affect the full year? The broker 32.2p adjusted EPS figure comes down to just 8.8p. Annualising the H1 cash UK profit share instead of accruing it would give 11p, so quite a difference. So it is trading on an adjusted PE ratio of 60x. And that's without including acquisition-related costs. Include reorganisation, amortisation of acquired intangibles and direct acquisition costs and they will make a loss.
But, these pension admin costs and deficit repayments won't go on forever, will they? Well, 10-15 years can feel like forever to investors:
At 31 December 2020, the weighted average duration of the defined benefit obligation in the UK scheme was 15 years (2019: 15 years) and in the USA schemes was 10 years (2019: 10 years).
Most investors don’t (or can’t) do pension scheme deficit analysis though, so perhaps there may be an opportunity to buy before results and sell to the ‘greater fools’.
Portmerion (PMP.L) - Trading Update
Portmeirion Group PLC, the designer, manufacturer and worldwide distributor of high quality homewares under the Portmeirion, Spode, Royal Worcester, Pimpernel, Wax Lyrical and Nambé brands, updates on full year trading for 2021.
They have been on a diversification spree recently thus Wax Lyrical and Nambe. We suspect they did this just as tastes finally turned back towards their more twee core products!
We are pleased to report an excellent Christmas seasonal trading period, with very high demand for our consumer homeware brands around the world and strong sell-through across our key channels. We therefore now expect sales to be at least £104 million or 10% above current consensus market expectation forecasts for FY21. This is 18% above 2020 sales of £87.9 million and 12% ahead of pre-Covid sales of £92.8 million in 2019.
10% is materiality and the point at which they have to report a variation from market expectations. Their last trading update was 11th November where they upped by 5%.
When the results were published in H1 Leo expected to see a Full Year revenue beat vs £90m forecasts. But by the 11th November trading update, he thought his £103m forecast revenue was looking very difficult given time left in the year. Yet they did it. So there seems to be some conservatism in their guidance here. We suspect they deliberately kept 5-10% back in the November update. Any more than 10% would have been misleading the market / required an interim trading update.
This represents the highest ever level of sales for the Group driven by strong progress on our strategy in developing new sales channels, particularly online.
As a result we expect our profit before tax for FY21 will be at least £7.0 million, an increase of 9% over current consensus market expectations and a multiple increase compared to £1.4 million in 2020.
Ideally, we'd like to see operational gearing mean profits grow faster than revenue. Hopefully, the implied increase in admin costs versus November expectations has a one-off element. But ultimately these figures are dead on what Leo forecast in September by splitting out recent acquisitions and considering the historical H1/H2 split.
We are mindful of ongoing Covid risks and their potential impact on sales markets, global supply chains and the associated cost inflation, particularly in container shipping.
People who don't follow the company may be surprised that they don't mention energy costs here. However, this was covered in November when they said:
We note the widespread press in recent weeks on energy intensive industries. We have made significant progress in recent years in reducing our energy usage and will continue to invest in 'green' initiatives as a core part of our strategy. As a central part of our business, our ceramics factory in Stoke-on-Trent buys energy under long term contracts. In the first half of 2021 we extended those contracts until early 2024. As a result, we do not expect to be materially impacted by the latest rising energy prices.
Of course, you don't hedge 100% of anything because reduced demand would leave you exposed to hedging losses. And given that demand has turned out to be strong since H1 2021, presumably production has been at the upper end of projections and so they will have suffered some increased energy costs, just not materially.
Here's the best news in the statement:
We expect further growth in 2022 and with the current uncertainty will wait to update the market with detail on the outlook for the current financial year at the time of the preliminary results in March.
So perhaps another upgrade is on its way?
Creightons (CRL.L) - Investor Presentation
With their results in between Christmas & New Year in order to avoid the deadline for share suspension, investors had to wait until this week for their results call. With no broker research available on the company, these calls have moved the share price in the past. There was a long Q&A and it is worth watching on PI World, since they explain some of the things we were unsure about - such as the inventory build, and seasonality of the business going forward. For those who don’t have the time, here is Leo’s summary:
So, again I was impressed by their presentation. They come across even better in real life and I hope to see them at Mello in May. The most important thing is that revenue and margin aspirations have been reiterated. Based on their guidance it does now look like my revenue projection for £64.1m for the FY is a bit hot, but maybe margins may be a bit low, so I'll stick with my 5.4p EPS guesstimate.
I think the biggest problem they have potentially got here is the share price. Clearly, they don't want to take on debt beyond invoice financing, and so will need to issue more equity to meet even the £40m from acquisition revenue target, let alone the £50m. If issuance happens at 100p then that should be fine. But if it happens below 80p or, worse with another guarantee to top it up if the share price is below 125p followed by a share price of 80p, then potentially we're potentially going to see more dilution than I previously expected.
With aspirations met and a strong market for issuance I see 9.2p for FY 2024 and a PE of 15 = 138p share price. That's an implied discount rate of 25% on today's share price. But the above could be beaten as well as missed, so for me, this makes a good investment.
Card Factory (CARD.L) - Trading Statement
At first glance, it seems strange that Card Factory should drop 17% on the following trading statement:
Card Factory plc, the UK's leading specialist retailer of greeting cards and complementary products, announces a trading update for the eleven months ended 31 December 2021.
Performance overview
- Trading for the FY22 period was ahead of the Board's expectations with performance recovering from April 2021, as Covid-related restrictions eased
So that is an ahead statement for the year to 31st January 2022. They guide at least £360m revenue which tops the £340m revenue forecast for FY22 that Stockopedia has. Which perhaps isn't surprising with other high street focussed businesses, such as Shoezone also reported very strong Decembers recently. PBT for FY22 still has quite a wide range though:
profit before tax ("PBT") for the full year is expected to be in the range of £7.0m - £10.0m.
But taking the £8.5m midpoint, this would mean Profit After Tax some 10% above the Stockopedia consensus. Still, this is only an EPS of less than 2p so this company is not being priced on 2022E earnings but on the expectation of a post-covid recovery. And here lies the sting in the tail:
The Board expects that the combined impact of unmitigated headwinds; predominantly the increasing cost of freight but also the impact of inflation on staff costs and utilities; plus investment in headcount, IT and development of the online platform to support the delivery of the strategic plan, will add approximately £30m to the pre-Covid FY20 cost base net of mitigation.
Store Wages + Store Property Costs + Other Direct Expenses + Operating Expenses excl. D&A came to £218.3m in FY20 so an additional £30m is a material amount and some 14% higher.
The reduction in net debt & deferred rent is welcome and puts them on a firmer footing, however:
As a result, the Group delivered a significant reduction in net debt, with net debt at 31 December 2021 of £60m (excluding lease liabilities of £130.1m), compared to £87.0m at 31 December 2020 (excluding lease liabilities of £148.0m) and £119.0m at 31 December 2019 (excluding lease liabilities of £143.0m). During the trading period deferred rents of £14.0m and VAT of £19.0m carried over from FY21 were paid. As of 31 December 2021, £7.0m of deferred rent was outstanding.
Generally, we are not a big fan of Enterprise Values featuring lease obligations. So £180m market cap +£60m net debt +£7m deferred rent + say £30m to account for the -ve working capital would be £277m EV. But then we need to back out the IFRS16 figures from the EBITDA for a true comparison. This requires full modelling, but as a shortcut, Card Factory do the adjustment for FY20 in their accounts:
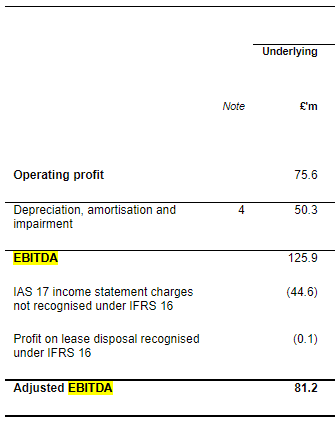
So if we take off the £30m extra costs and assume revenue etc. is similar then you get £51.2m EBITDA ex-IFRS16, which is 5.1x EV/EBITDA. Doesn't seem that expensive, but this isn't the highest quality business.
What would make it good value is if they can mitigate the cost increases (or they subside) in 2024. And of course, if they meet their aspirations on revenue:
The Board remains confident in the growth potential for the Group and the achievability of the long-term guidance set out in September 2021 at the interim results, with revenues in excess of £600m for FY26.
The market is forward-looking but the year ending Jan 31st 2025 may be a bit too far in the future for many, even those highly “aspirational” Creightons' holders. With so long to go to this target and medium-term headwinds, it would seem wise to adopt a wait and see approach, even if you end up paying a bit more for greater certainty in the future.
Minds & Machines (MMX.L) - Tender Offer & Cancellation
MMX was once fairly popular with some private investors as they controlled the .london and various porn top-level domains. Following a fairly egregious misrecognition of revenues, they rather lost trust, however.
In April 2021 they proposed to sell their assets.
After payment of estimated transaction costs (including estimated taxes payable by the Company) ("Transaction Costs"), this represents an estimated net asset value (at the Exchange Rate) of 8.8 pence per Ordinary Share (the "Estimated Offer Value Per Share").
But it was unclear what would happen to the cash:
Following receipt of the Consideration the Board will consider the best way to maximise Shareholder value which is likely to include returning a proportion of the cash to Shareholders together with considering alternative acquisitions as provided under Rule 15.
Following completion they said:
The proceeds received on Completion, plus those amounts held in escrow and the cash generated by MMX through the Completion date, represents an implied NAV of approximately 9.6 pence per Ordinary Share (based on the current Exchange Rate of GBP:US$ of 1:1.38). This estimate includes a provision for estimated transaction costs (including estimated taxes payable by the Company), and the Group's ongoing operating costs not covered by the Transition Services agreement.
This was followed in September by:
Return of up to £58,000,000 (approximately US$80,000,000) to shareholders via a Tender Offer at 9.6 pence per Ordinary Share
But it remained unclear what would happen to the rest of the cash, and pricing throughout indicated a lack of trust in management. Today they announce:
Following completion of the fully subscribed October Tender Offer in October 2021, which returned $80.0 million to Shareholders, the Board has considered its options with regards to how best to utilise the Company's remaining available capital and its public market listing. The Board has concluded that the return to Shareholders of the maximum amount of remaining available capital as part of an orderly winding-up of the Company, and the Cancellation of Admission of its Ordinary Shares to trading on AIM, is in the best interests of the Company and its Shareholders.
And so we now have:
Return of up to £19 million (approximately US$26 million) to shareholders via a Tender Offer at 10.4 pence per Ordinary Share
Although:
Up to 182,692,308 Ordinary Shares will be redeemed, representing approximately 67.3 per cent. of the Company's issued share capital (if the Tender Offer is fully subscribed).
But:
The Tender Offer is open to all Eligible Shareholders on the Company's Register of Shareholders at 1.00 p.m. GMT on 28 January 2022 (the "Closing Time") who may participate by tendering all or a proportion of their Ordinary Shares at 10.4 pence per Ordinary Share.
Yet:
On the basis the Tender Offer is fully subscribed and all Shareholders are Eligible Shareholders, each Shareholder shall be entitled to tender 1 Ordinary Share for every 1.485 Ordinary Shares held by them on the Record Date. Shareholders do not have to accept the Tender Offer.
Directors are tendering 100% of their entitlement with the remainder of their holdings as excess shares. Lombard Odier have only undertaken to tender their basic entitlements. But that is probably a technicality. So, what is the share worth to people buying now? The simple answer is 10.4p/1.485 = 7p, plus a share of an unlisted company.
But it is slightly more complicated than that because some people will fail to tender their basic entitlement and so shareholders should get a little more. The last tender was on the basis of one in every 1.45 shares and had 96.7% take-up. You might speculate that those shareholders remaining are more likely to be in the 3.3% that didn't tender last time, and won't tender again. But on the basis of last time, the uplift to that 7p will be tiny.
So, what is the remainder of the company worth, and what will happen to it?
$11.9 million of which is held in escrow to be released (subject to set-off in accordance with the terms of the relevant escrow agreement) on 31 March 2022.
Tendered shares will be paid for on 7th February, so presumably that $11.9m (less offsets) will be the bulk of the remaining company assets.
Remaining shares in issue after redemption will be 60m.
So 20c per share, less any offsets, plus any other assets.
Accordingly, the Board is proposing the cancellation of the Company's shares being admitted to trading on AIM (the "Cancellation") to reduce the Company's operating costs prior to an orderly winding-up of the Company and return of the remainder of remaining net assets later in 2022.
So, on the face of it, good for residual holders. But where did this 10.4p come from?
The Company estimates that total net assets of the Company, including Available Cash and Escrow Cash, but net of current liabilities and estimated tax liabilities and estimated professional, operating, and other costs required to wind-up the business and to be paid after the date of this Document ("Net Assets") is US$38.7 million (£28.2 million at the Exchange Rate), representing a net asset value of approximately 10.4 pence per Ordinary Share.
So, the 10.4p does not include contingencies. It is the only buying back 67.3% that provides the contingency. And many investors will have problems owning unlisted shares in tax-free accounts. So we could well see selling of the un-tendered shares, making the rump good value. This play only really works for investors who a) have funds outside of tax-free accounts b) are happy to hold unlisted shares c) have a broker who is happy for clients to hold unlisted shares. I.e. not us!
Simgon (SIM.L) - Proposed Merger & Delisting
Microcap Simigon get a deal at 227% of their current market cap - but it's a merger and has a delisting from AIM associated with it.
The consideration per share to shareholders of SimiGon ("Merger Consideration") is expected to be $0.165 per share (before any upward adjustment in the relative valuation of SimiGon), that represents a premium of 226.86% to the average closing price on the AIM Market for the last 12 months, a premium of 250.66% to the average closing price on the AIM Market for the last 6 months, a premium of 285.54% to the closing price on the AIM Market on the last full trading day immediately preceding the public announcement of the Merger and a premium of 285.54% to the closing price on the AIM Market on Thursday, 13 January 2022 (being the most recent practicable date prior to the date of this announcement).
This shows that sometimes things end up so cheap that something has to happen. The complexity of the deal, liquidity and trust of management prevents us from playing this one though. Maxify Solutions Inc. doesn't appear to have any intention of being listed so this really is giving your money to an unlisted black box and hoping for a return. And in this sense, the pricing of the merger is largely academic.
However, this is another deal for finnCap as broker & NOMAD and further cements Mark’s view that finnCap must be on to beat market expectations for FY22, at least on revenue. finnCap are running the tender offer for MMX and also acting as sole bookrunner to a secondary placing of management shares at SDI on Friday. Looking at the deals finnCap have done in the last 3 months or so they must be pushing the upper limit of their £45-50m revenue guidance for the full year, with at least 2 months to go.
That’s it from a monster SCL - have a great weekend!