


Small Caps Live Weekly Summary
BILN CAPD FA HTG HUM PAY QUIZ THRU VLX; Why did SVB fail?


Takeovers and delistings are gathering pace in the UK markets. This is a worrying trend. The message to UK investors seems to be to recognise the opportunities presented by UK equities or someone else will. In the short term, a takeover is a nice blip for the portfolio. Especially while there are so many opportunities to redeploy capital into cheap companies. Longer term, it may reduce investment opportunities and sideline UK markets further.
As well, as the usual small cap summary, WayneJ is back this week looking at the fallout from Silicon Valley Bank's failure on the wider banking sector.
Small Caps
Billington Holdings (BILN.L) - Results for the year ended 31 December 2022
These are great results, as already flagged by their trading statement, with the share price doubling in the last six months. However, with 39p EPS, these appear to be a miss against expectations:
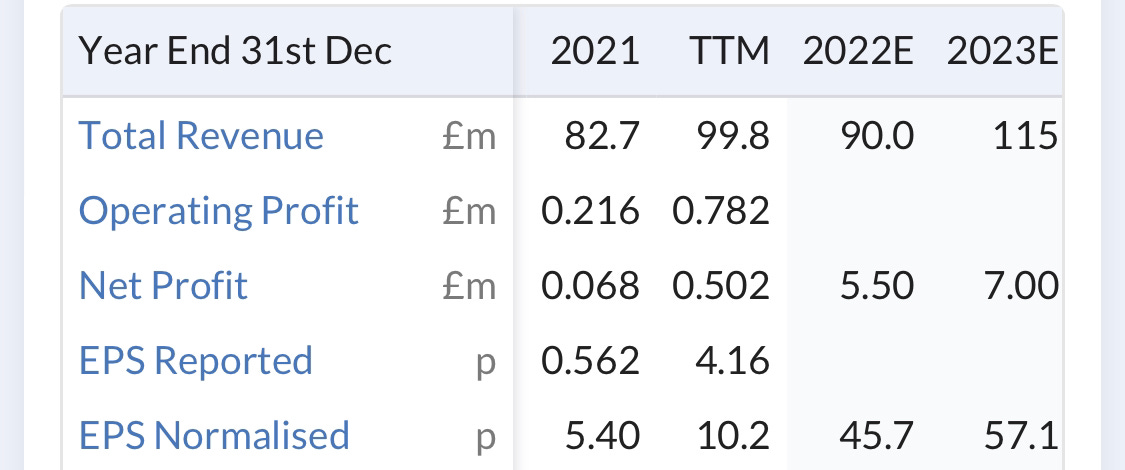
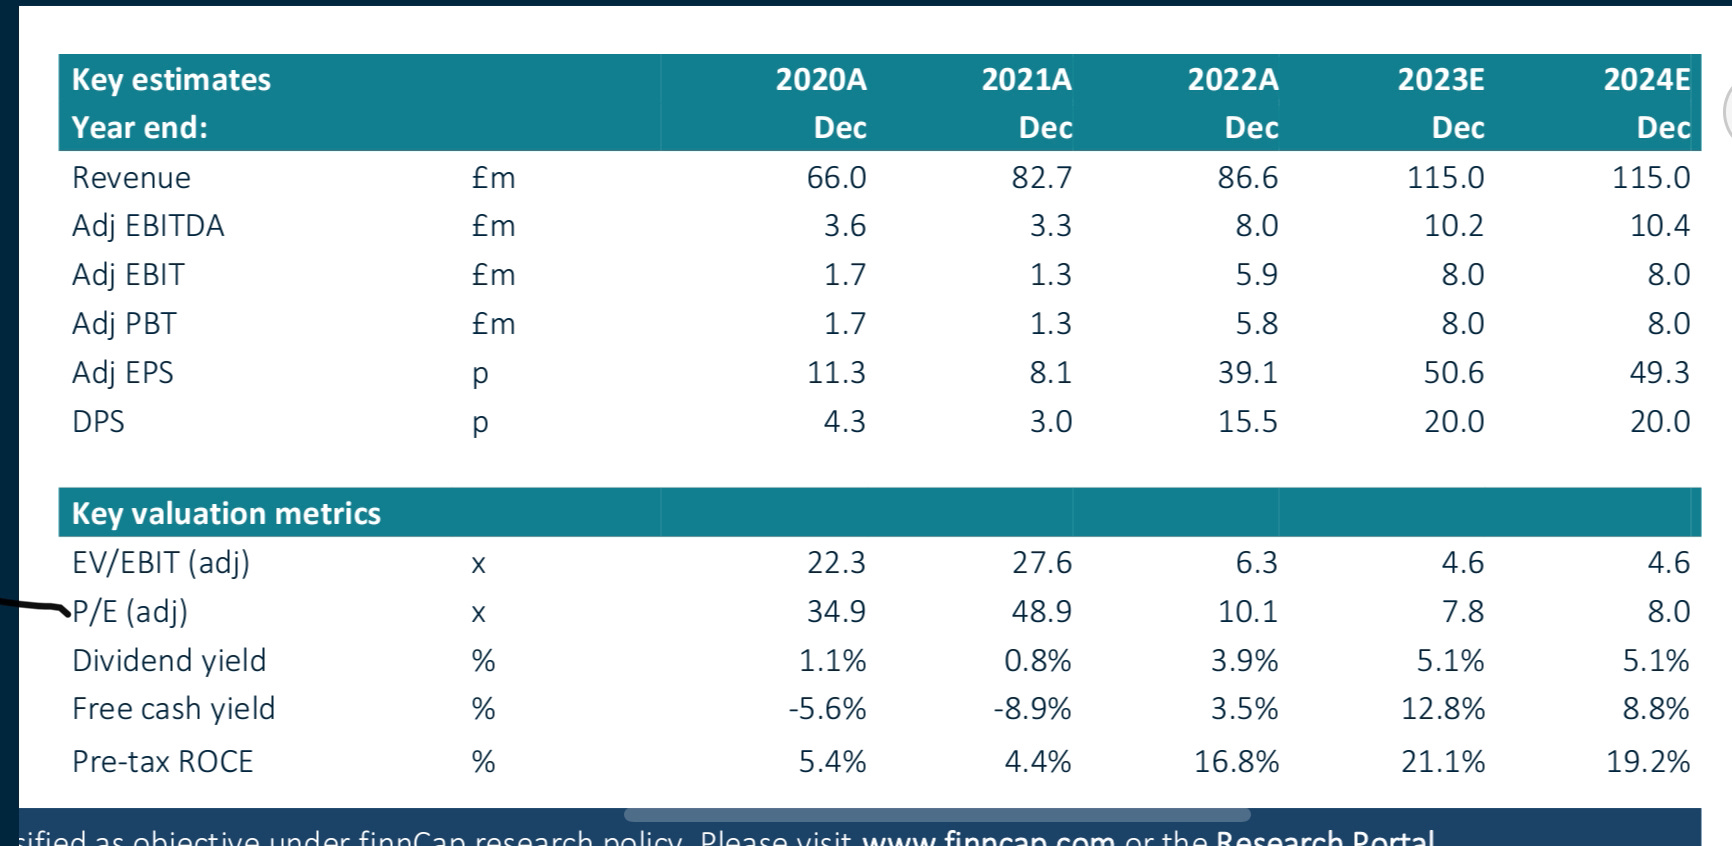
It’s not adjustments, since finnCap go for 39.1p in their latest note:
This is the previous forecasts:
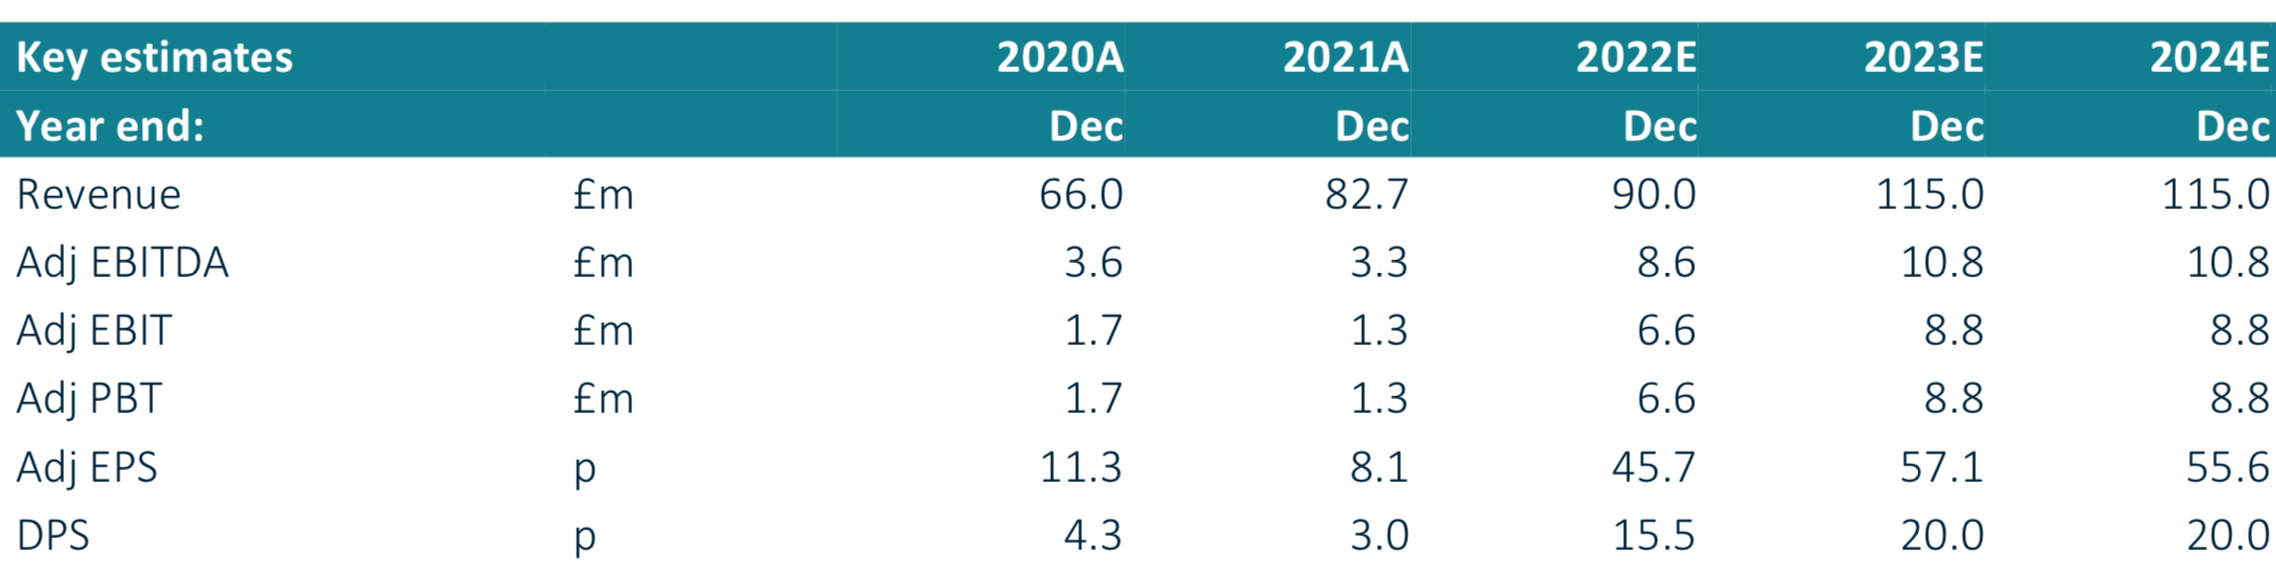
This appears to be partly due to how they account for share-based payments. But finnCap saying these are in line with expectations, while simultaneously reducing the numbers seems incongruous.
Capital Limited (CAPD.L) - Q1 Trading Update
A steady but not exceptional quarter:

The focus appears to have been on generating high ARPOR, with further strength expected for the rest of the year. Decommissioning has reduced the fleet, and utilisation has dropped a little as it’s hard to maintain more than 80% for any significant time given the requirements to maintain the fleet.
Our understanding is that new rigs have arrived in Q1, they just haven’t been added to the rig count until commissioned, and the drop in fleet is simply timing around this. The new rigs will be headed straight to contracts, but the utilisation won’t see a big jump since this will allow further rig rotation. Still, similar utilisation on a larger fleet, with ARPOR trending upwards, will see revenue increase during the year. The old rigs were fully depreciated and were broken up for spares, given that they wouldn’t want to sell them on to a local competitor.
So this update is unlikely to move the market. However, the company remains at a material discount to listed peers despite much longer and, therefore, higher-quality contracts, plus their fast-growing labs business is the jewel in their crown.
Pendragon (PDG.L) - Interim Management Statement
As we know, the used market (apart from EV, which dealers are avoiding) remains exceptionally strong, but this is still impressive on strong comparables:
Underlying Profit Before Tax of £23.0m, up 23.0%, or £4.3m vs. Q1 FY22 (£18.7m)
Specifically on used:
The used GPU remains well above historic levels at £1,457, albeit this was 17.7% behind the strong Q1 2022 used GPU of £1,771 which still benefitted from the uniquely elevated market conditions.
(We assume GPU = gross profit per unit)
However, profits were only that high due to exceptionally tight supply conditions, which hit volumes. While they claim some company-specific factors, much of the 14.0% YoY increase in volumes will be in line with the market. The factors at play in new vehicles are also well-rehearsed:
New vehicle volumes were 20.1% higher than the prior year on a like-for-like basis, against a retail market up just 0.4% and a total market up 18.4%. The Group continued its focus on maximising margins through reduced levels of vehicle discounting, which, combined with manufacturers focussing on production of higher margin models, resulted in new vehicle gross profit per unit ("GPU") of £2,686, up 9.4% or £230 compared to Q1 FY22.
As a result:
New gross profit was up 31.2% on a like-for-like basis compared to prior year.
This combination of resilient used and growing new sales is self-limiting and cannot continue for long, though. Aftersales is also exceptionally strong, although the comparables may be weaker here after reduced miles driven in the year to Q1 2022 owing to lockdowns. In addition to the normal three business lines, they have a software business which is starting to become significant to the bottom line:
The Group's software business, Pinewood, delivered operating profit growth of 14.3% to £3.2m (Q1 FY22: £2.8m), driven by the combined impact of both UK and international user growth, and increases in the average revenue per user.
They do not comment on the legal action against Pinewood that scuppered a takeover bid around the turn of the year. They also have a leasing business which could be particularly badly affected by any fall in used values. But the most incredible thing about their Q1 was that the headline PBT figure was achieved despite a >50% increase in interest costs, mostly down to higher interest rates. The operating figure was up 32%, remember on strong comparables. In the outlook, they say:
There are encouraging signs of improvement in production and supply of new vehicles, although used vehicle supply is expected to remain tight for the foreseeable future.
That sounds pretty much the sweet spot for the industry.
as a result of the strong performance in Q1 it expects to comfortably outperform the Board's previous expectations for FY23.
Sounds like they are only factoring in the beat of Q1 over their (and any reasonable commentator's) previous expectations, not extrapolating it forward. Broker Zeus upgraded FY23 EPS from 2.6p to 2.9p (12%) and reduced year-end debt expectations by £3.4m. There are no changes to earnings forecasts for subsequent years, but the debt situation is expected to improve further. But we have not checked what kinds of stocking loans are included in the debt figure. Further upgrades seem likely across the industry.
FireAngel (FA.L) - Techem Partnership Agreement
Maybe it is time to start taking this company a little more seriously. Could this dog have another day? Here's the bull argument: EPS is forecast at 1.4p in late 2024, with further momentum from the Techem partnership coming through in 2025. At the end of March, Shore published a note saying:
We expect to publish a note showing a scenario analysis of what the contribution of the c.€5 per NGSA from Techem could be worth to FireAngel in FY25F at the time of the final results
In today's RNS we get the claim:
The total income opportunity for FireAngel has grown significantly to an aggregate of up to c.$7.50 per alarm (comprising fees, royalties, and purchase price of the Company's own CO sensor) based on the same previously announced number of units planned for production.
The CO sensor manufacturing is a hidden gem in the turd that has been FireAngel over the past several years. But here's the first problem:
Two delivery and production agreements signed between three parties - FireAngel, its long-term manufacturing partner (the "Manufacturing Partner") and Techem Energy Services GmbH ("Techem").
They have repeatedly proven incapable of selecting and managing the relationship with a manufacturing partner. We assume by long-term partner, they mean Flex in Poland. However, FireAngel simply never managed to get Flex to produce reliable fire alarms at a cost that was profitable. Some of the problems are with batteries that FireAngel specified, but much of it is around design and an apparent breakdown in the relationship.
Shipments of the new alarm expected to start in 2024 with production volume building in 2025.
FireAngel remind us that the project started in 2021, probably with discussions the prior year. As a reminder, this is for a fire alarm with no identifiable innovations, not a mission to Mars.
on 20 March 2023, the Company announced the successful delivery of the fourth development milestone of the agreement (now 41 per cent. complete)
Almost certainly that simply means that 41% of the budget has been spent.
The Company and the Manufacturing Partner have had a long-standing and successful relationship involving product procurement and outsourced manufacturing since 2017.
The relationship with Flex simply cannot be described in that way. So perhaps they have someone else in mind?
Pursuant to the terms of the DC, initial shipments of the NGSA are expected to commence in 2024. Volumes are expected to build up further during the first half of 2025. The planned maximum annual throughput would be up to 1.8 million alarms.
So let's say 1m in the first year at $7.5 each = £6.1m turnover, maybe £10m in the second year. 2022 revenue of £57.0m has been guided, so this agreement potentially represents an uplift of 20%, but presumably at much higher margins.
Given the previous performance, we cannot overstate what a large risk FireAngel being responsible for managing the manufacturing partner presents. On balance, the argument could be made that this is a speculative short-term buy, but it is vital that investors remain objective with this serial disappointer.
Hunting (HTG.L) - AGM & Q1 Trading Update
Hunting reports a strong quarter:
EBITDA in Q1 2023 was $22.6 million, which compares to $6.7 million in Q1 2022 and $15.8 million in Q4 2022. EBITDA margin has strengthened in the reporting period driven by higher facility utilisation and some improvements to pricing, and is in line with market guidance of c.10% for the year as a whole.
although in line overall and Q1 is almost exactly 1/4 of their targetted EBITDA, which could be taken 2 ways. Either a sign of momentum and a possible beat, or a warning that they need 4 “strong” quarters to simply hit expectations. Too early to really judge.
Moving to a net debt position due to working capital build is slightly disappointing given that they had so much net cash at 2019 year-end and inventories already look high. It seems they perhaps still have a lot of slow-moving stock, despite big write-downs in 2020. They need to shift these, as well as see continued improvements in trading for their strong asset base to really become productive again. They are indicating back into net cash by the end of the year which may mean positive movements on this.
However, the US rig count is dropping according to Baker Hughes. So risks to the peak demand in this cycle remain.
Hummingbird Res. - Q1 2023 Operational and Trading Update
This is the second string quarter in a row with 27.3koz produced:

So it looks like the issues at Yanfolila are behind them, at least in the short term. What is also promising is that 23Q2 guidance is expected to be similar, and 23Q1 AISC is down to c.$1100 vs c.$1250 for 22Q4.
Gold is $100/oz more so 23Q2 EBITDA can be expected to be $2.7m higher than Q1 on similar production or around $20m. Maybe more as cost savings continue to work their way through:
As noted in our Q4 2022 Operational and Trading update, a detailed cost control and reduction programme at Yanfolila was initiated and remains ongoing with cost improvements starting to come through at site.
Q3 is expected to be lower production as they move away from higher-grade areas, but by this time, Karoussa will be in production. Management cut this fine in the end with the earlier problems at Yanfolila, but they seem to have been saved by a better contract miner, higher grade ore and a high gold price. Other 200koz gold producers are valued at many multiples of Himmingbird’s market cap, despite recent rises in share price. The upside here remains significant, even if shareholders would be wise to temper their excitement, given the rather patchy track record of late.
Paypoint (PAY.L) - Post-Close Trading Update
The Group anticipates that profit before tax will be at the top end of the range of market expectations
The results date is given as 6th July, later than usual due to the acquisition of Appreciate.
They also seem optimistic about FY2024. However, Stockopedia is showing an updated reduced forecast for FY 2024. However, broker coverage from Liberum still has a 58p 2024 EPS forecast. And 64p for 2025. Meaning they look cheap on a PE and yield basis.
Quiz Clothing (QUIZ.L) - FY23 Trading Update
This is given as at least in line with expectations:
The Board is pleased with the positive performance during the year and that FY23 profit before tax is anticipated to be at least in line with current market expectations.
But we can't help thinking the market may be focussing on this bit:
However, the widely reported and significant pressures on consumer spending seen in recent months are expected to continue into the new financial year. The Board believes these external headwinds may impact consumer demand across the Group's sector over the coming months, reducing its visibility for FY24.
So that sounds like a profits warning for FY24. Backed up by momentum going away from them at the end of FY23:
…like-for-like revenues in February and March 2023 were lower than the previous year. However, despite the challenging trading conditions in recent months, Group revenues in the final three months of FY23 were broadly consistent with those generated in the comparable period in FY2019, that being the last period unaffected by coronavirus related factors.
They should be financially strong enough to weather any downturn in trading, though:
The Group's net cash balance at 31 March 2023 was £6.2 million, comprising a cash balance of £7.6 million offset by a £1.4 million drawdown of available bank facilities (FY22: net cash balance of £4.4 million).
However, net cash is down by £3m from the £9.2m at the half year. Presumably, this has gone into inventories. We are not convinced there should be an obvious reason why dress-wear inventories should be higher in March than September, apart from simply cost inflation on similar stock levels. So presumably, some of this increase in inventories is that the drop in trading in February & March was unexpected?
Margins are holding up:
Gross margins for the year were in line with management expectations and consistent with those recorded in the previous year.
However, this is probably too soon to include any stock write-downs or promotional activity, if they are overstocked at the year end.
Forecasts have now been updated on Stockopedia, which are presumably house broker Panmure Gordon who don’t like to share the details with smaller shareholders.
FY to Jan 2023 cut from 1.6p to 1.3p (seems strange!), 2024 cut to 1.7p, giving a forward PE of 7x with a 15% discount to tangible book. Even with the reduced cash balance, this still seems cheap.
Thruvision (THRU.L) - Year-End Trading Update
This is a big miss versus Leo’s expectations, and we’re sure they said they expected breakeven, which an EBITDA loss clearly isn’t:
Revenue is expected to be in the order of £12.4 million (FY22: £8.4 million), representing growth of approximately 48%.
The Board anticipates that the Adjusted EBITDA loss will be in the region of £0.2 million (FY22: loss of £1.7 million).
Cash balance on 31 March 2023 was £2.8 million (31 March 2022: £5.4 million), reflecting the post year-end timing of payments for orders delivered in February and March.
And a significant proportion of orders sales were in the last two months again, affecting cash. Compared to December's Progressive note this is a small miss: Revenue £12.4 vs £12.7m, EBITDA -£0.2m vs £0.1m, cash £2.8m vs £4.0m.
They claim on customs:
During H2, we successfully delivered all the upgraded and new high-performance systems that had been ordered.
However, on retail:
Performance in our Retail Distribution market remained resilient in the face of challenging conditions for our customers.
So we'd guess the miss was due to the retail side. Further on customs:
Over half of these have already been deployed by CBP with further significant operational success.
Nearly half not deployed either suggests they were delivered late in the period, or they are not in a rush to deploy them, or just usual government bureaucracy. Historically their customers are good payers, including the US government.
Progressive have an updated note, but it is not very helpful as they now say:
Given the unusually high levels of macro uncertainty impacting the retail sector and the lumpy nature of customs revenues, we have chosen to await further updates before introducing FY24 estimates.
Investors seem to have missed the bad news here as the share price was up in response, giving an opportunity to take profits.
Volex (VLX.L) - Full Year Trading Update
Volex say:
Full year trading ahead of market expectations
However, looking at the figures they give. Revenue is 2.4% ahead of consensus, and operating profit is 4.9% ahead. So while good news, this isn’t exactly groundbreaking. That the share price was up 14% on a 5% profit beat is perhaps a reflection that investors were fearful of a miss here.
Cash generation is good, with net debt now 1x EBITDA. However, there are indications are it will increase again:
The Group has an active acquisition pipeline of value enhancing opportunities, which will support the achievement of the five-year strategy to grow revenues to $1.2 billion by the end of FY2027.
Given that Downing still seems to be selling, it would be unwise to chase the stock at these levels.
Why did Silicon Valley Bank fail?
There has been a lot of pontification about why SVB failed and pointing to everyone from the US government, to the FED, FDIC etc. I think the original sin is much more fundamental. SVB was a bank with a balance sheet of about $200 BN. Just think about that for a moment. $200BN is seriously big - and even more so for a bank which had - IIRC -about 17 branches.
Originally US banking regulations kicked in with increased supervision at $50BN - however, a bunch of US banks - arguably led by the CEO of SVB pushed Congress to legislate to classify US banks with less than $250BN on their balance sheet as 'small' banks - which meant that a whole raft of regulation did not apply to them.
So I have spent a while digging into some UK / European banks over the last few months - and I am struck at how banks a fraction of the size of SVB in Europe provide disclosure on key Basel III ratios in a way that SVB and other US banks simply fail to. (Remember SVB was a top 20 US bank). So the argument that the overhead of regulation for category IV US banks would have been too much, I think, is found wanting. Why can a European / UK bank a tenth the size do the regulation?
So SVB was technically a US category IV bank - and as a result, did not have to publish an LCR or NSFR ratio. Imagine you are running a bank. Your business model is essentially maturity transformation - you take short maturity liabilities (deposits - remember that deposits are liabilities for a bank) and transform them to longer duration assets (i.e. loans - remember that loans are assets for a bank).
The issue you face is that you have a liquidity mismatch - you need to have money (or its equivalent) at hand to deal with reasonable expected withdrawals from the bank. In order to do this, you could hold some cash in the vault, but obviously, that does not generate a return.
So you end up holding HQLA - high-quality liquid assets - that translates as US treasuries and other short-term cash equivalents (e.g. deposits at the Fed itself). The US treasury market is meant to be the most liquid market in the world - and as a backstop, you can go to the Fed's discount window and borrow against your treasuries (lender of last resort). So how much HQLA should a bank hold? This is where the NSFR and the LCR come in.
NSFR looks at a bank's available funding (i.e. its sources of capital) and how much it requires. Thus the NSFR is simply Available Stable Funding divided by the Required Stable Funding (so NSFR = ASF / RSF). Obviously, some sources of funding - e.g. a 10-year fixed deposit - have different characteristics from other funding, e.g. a (on-)demand deposit.
But the ASF also depends on the size of the depositors - someone with up to $250K in a US bank prior to SVB was comfortable that their deposit was insured. However, if you had a $50M deposit (e.g. Peter Thiel), then you had no protection, so you were more likely to withdraw in a crisis. So a formal calculation for ASF looks at the different types of funding a bank has and haircuts it according to the type of deposit and the size of the deposit, and the likely behaviour of the client.
A similar calculation is done on the assets - (and I think this is potentially a massive point going forward) - a 10-year loan by a property developer who is looking to 'flip' a development in months is likely to be paid down fast; a 30-year fixed rate residential mortgage in the US usually has the option of early paydown -but whether people pay down depend so the interest rate environment.
So going back to NSFR - the usual expectation is that the NSFR ratio ought to be above 100% - many European banks will run at 120 - 140% or even higher. In the case of SVB, the original sin was that during Covid, many VCs raised tons of capital, as did their startup companies, so SVB (as the preferred bank of Silicon Valley) got a glut of inflows (deposits) - I have read reports of it being as much as $100BN.
Remember, these are large deposits (so uninsured) from VCs (who are going to deploy the capital) or VC-backed companies (who are going to burn the cash as they are often loss-making). So any rational banker would consider that these deposits are high risk and assign a large haircut in their ASF calculations. Let’s just think that through for a second - a bank has a startup that deposits $100M from a fundraise. That startup is burning cash - so it is likely to burn through that $100M in probably 3 years (and then have to raise more...if it can). So we ought to assume a large haircut - that $100M is not a permanent long-term reliable deposit.
Instead, SVB deployed that deposit and lots of others in longer-duration bonds - both govt and some mortgage-backed securities. And being a US category IV bank, it did not even bother calculating an NSFR - like King Canute, it thought it could defy nature. My suspicion is that if there had been a formal NSFR calculation, it would have been quite clear that the NSFR for SVB was significantly below 1, and that would have led to alarm bells (despite the chair of the Risk Committee being a vineyard owner).
And that brings us on to the LCR - liquidity coverage ratio. A bank needs to estimate how much withdrawals it might face in a month (technically 30 days) and ensure that it has cash (in the vaults or at the central bank), cash equivalents (deposits at other banks, the Central bank etc.) and HQLA that can cover 30 days of anticipated withdrawals. The lack of a sufficient NSFR meant that when fear hit, SVB had a massive bout of withdrawals. The result was that it lacked liquidity - and that meant it had to sell some of its longer maturity holdings - which led to it being forced to recognise mark-to-market losses - which hit its shareholders' equity, and it became insolvent.
The riposte, to me, is likely to be that no bank can hold sufficient liquidity to handle the outflows that SVB had. SVB had about $13.8 B of cash on its balance sheet at year end. But it was facing about $6.5 B of withdrawals per month (slightly complicated as some of the withdrawals were from money market funds it managed rather than its own deposits). So arguably, in 2 - 3 months, it was about to run out of cash and have to sell down its treasury portfolio anyway.
So going back to how and why SVB failed - we have a bank that grew massively during Covid, that had massive inflows of unstable, flightly deposits, with clients (startups) that were going to burn through the cash anyway (as loss-making) - that decided that as a category IV bank (which it had lobbied for) it did not need to report NSFR and LCR, and so would not even bother monitoring them - and as a result invested flightly deposits in long duration paper. And given the business model, customer base and concentration, I think it was ultimately bad management.
Actually, a few dozen US banks get closed down or bought every year - just that normally there is not so much drama about it because they are small or not the 'techbros'. There are a few bank opportunities that I think will emerge on a 2 - 5 year holding period as a result of this whole debacle.
That’s it for this week. Have a great weekend!
Great updates as usual, thanks guys.